
- Written by: Amanda Conway
- Last Updated: December 23, 2025
Your warehouse looked fine when you were shipping 50 orders a day. Now you’re pushing 500, and suddenly everything’s on fire. Your team spends half their time hunting down misplaced inventory, carrier rates jumped again last quarter, and customers expect two-day shipping like it’s a human right.
Welcome to direct-to-consumer/DTC fulfillment at scale. It’s messy, expensive, and unforgiving when you get it wrong.
Most DTC brands hit a wall somewhere between in-house chaos and writing a check to a 3PL they don’t fully trust. You’re stuck wondering if you should build better systems, hire more people, or hand the whole operation to someone else.
This guide cuts through that confusion. We’ll walk through how modern DTC fulfillment actually works, what it costs, when to outsource, and how to stop bleeding margin on shipping. No fluff, just the framework you need to make a decision.
DTC fulfillment (direct-to-consumer fulfillment) is the end-to-end process of receiving, storing, picking, packing, and shipping orders directly from a brand to individual customers, plus handling returns. Unlike B2B or wholesale fulfillment, DTC order fulfillment handles single-unit orders with individual packaging and consumer delivery expectations. For brands scaling from $1M to $10M in revenue, fulfillment infrastructure must evolve through distinct stages to maintain profitability and customer satisfaction.
The operations that got you to $1M will break at $3M. What works at $3M becomes expensive and slow at $10M. Your fulfillment infrastructure needs to evolve with your revenue, and the timing of those upgrades determines whether scaling feels manageable or catastrophic.
Poor decisions at the $1M-$10M stage create expensive problems: stockouts that kill momentum, slow shipping that loses customers, margin erosion that limits growth capital, and customer experience issues that tank retention. 68% of DTC brands cite frequent delivery delays as their top operational pain point, while 65% report that issues between fulfillment and last-mile carriers negatively impact customer experience.
For Canadian DTC brands specifically, fulfillment complexity compounds with vast geography, sparse population density outside major metros, and cross-border considerations as you expand to US markets. This guide focuses on the Canadian DTC landscape while providing frameworks applicable to North American growth.
TL;DR: DTC Fulfillment Essentials
- DTC fulfillment services handle warehousing, picking, packing, shipping, and returns for individual consumer orders
- Fulfillment infrastructure must scale in stages: In-house works until $1-3M, professional operations needed by $3-5M, distributed inventory required above $8-10M
- Cost vs. speed is a false tradeoff: 65% of brands using carrier diversification reduce costs while 55% improve delivery speed—you don’t have to choose
- Technology gaps kill growth: 77% of startups identify real-time inventory tracking and last-mile cost analytics as critical, yet most lack these systems when they need them most
- Start upgrading 6-12 months early: Migrating fulfillment during a crisis is expensive and risky—audit quarterly and invest before you hit capacity, not after
Table of Contents
What is DTC Fulfillment and Why It Matters
What is DTC Fulfillment
DTC fulfillment is the complete process of receiving inventory, storing products, picking and packing individual orders, shipping directly to end customers, and processing returns. This differs fundamentally from B2B or wholesale fulfillment, which handles bulk orders shipped to retailers or distributors rather than individual consumers.
How Does DTC Order Fulfillment Work?
DTC order fulfillment follows a specific workflow:
- Receiving: Inventory arrives at the fulfillment center from manufacturers or suppliers
- Storage: Products are organized by velocity (fast-movers in forward pick locations)
- Order Processing: When a customer orders, the system generates a pick list
- Picking: Warehouse workers collect items for the order
- Packing: Items are packaged with branded materials and shipping labels
- Shipping: Orders are handed to carriers for delivery to customers
- Returns Processing: Returned items are inspected, restocked, or liquidated
What Do DTC Fulfillment Services Include?
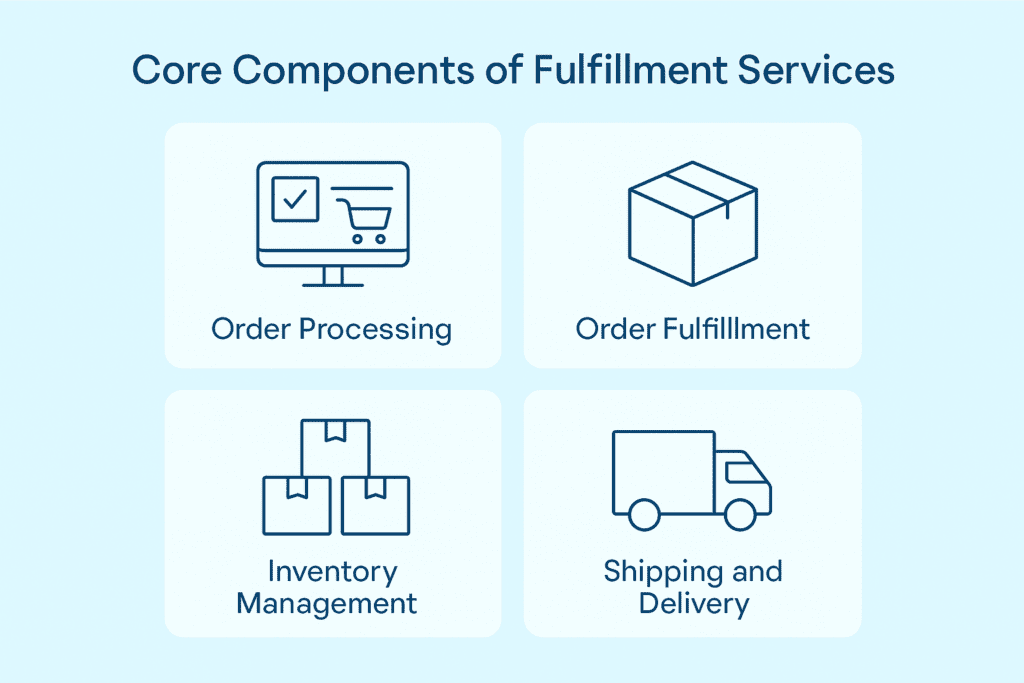
DTC fulfillment services typically include warehousing and storage, inventory management, order processing, picking and packing, shipping coordination, returns processing, and technology integration with your e-commerce platform. Professional 3PL providers (third-party logistics) offer these services at scale, allowing brands to outsource operations.
Core DTC fulfillment services:
- Warehousing: Physical space to store inventory with climate control and security
- Inventory management: Real-time tracking, demand forecasting, reorder point management
- Order processing: Receiving orders from multiple sales channels, routing to appropriate fulfillment location
- Pick and pack: Retrieving items, quality control, branded packaging, label printing
- Shipping: Carrier rate shopping, label generation, tracking, delivery coordination
- Returns management: Receiving returns, inspecting condition, restocking or liquidating
- Technology integration: WMS (warehouse management system), OMS (order management system), ecommerce platform integrations
- Value-added services: Kitting, customization, gift wrapping, subscription box fulfillment
The $1M to $10M Fulfillment Evolution
At $1M annual revenue (~250 orders/day): In-house fulfillment or basic 3PL works. Single warehouse location, simple technology stack, limited SKU count. Operational complexity is manageable.
At $3M (~750 orders/day): Professional warehouse operations essential. Technology integration becomes critical—manual processes break down. Inventory planning gets complex. Shipping costs become significant margin factor.
At $10M (~2,500 orders/day): Distributed inventory across multiple nodes, sophisticated demand forecasting, carrier diversification, dedicated returns processing, and sustainability initiatives become necessary.
The transition periods between these stages create the most risk. Upgrade infrastructure too early and you’re paying for capacity you don’t need. Wait too long and you’re firefighting operational crises. The brands that scale successfully invest 6-12 months ahead of capacity constraints.
Core Components of Scalable DTC Fulfillment
Physical infrastructure: warehouse space, material handling equipment, packing stations, inventory storage systems
Technology layer: WMS, OMS, inventory management software, carrier integrations, analytics platforms
Process design: receiving protocols, put-away strategies, pick-pack workflows, quality control, shipping procedures
Network strategy: fulfillment center locations, inventory distribution logic, carrier partnerships
Each component must scale in coordination. Technology without good processes fails. Distributed inventory without demand forecasting creates waste.
How Much Do DTC Fulfillment Services Cost?
How Much Do DTC Fulfillment Services Cost?
DTC fulfillment services typically cost $3-7 per order plus monthly storage fees. Total costs depend on order volume, product characteristics, storage requirements, and service level agreements. Most 3PL providers charge separately for receiving, storage, pick and pack, shipping, and returns processing.
Typical DTC Fulfillment Pricing Structure
Per-Order Fees:
- Receiving: $0.25-$0.50 per item received
- Storage: $30-50 per pallet per month OR $0.50-$1.50 per cubic foot
- Pick and pack: $2-5 per order (varies by number of items)
- Shipping: Pass-through of carrier costs (plus markup in some cases)
- Returns processing: $2-4 per return
- Special services: Kitting ($1-3 per kit), custom packaging ($0.50-2 per order), gift wrap ($2-5 per order)
Additional Costs:
- Account management fees: $0-500/month
- Technology/integration fees: $0-300/month (often waived)
- Minimum monthly fees: $500-2,000 (for low-volume accounts)
All-in benchmark: Healthy DTC brands target 8-12% of revenue on fulfillment costs. Above 15% indicates inefficiency or low average order value. Below 6% typically means very high AOV or you’re underserving customers with slow, cheap shipping.
In-House vs. DTC Fulfillment Services: What's the Difference?
In-House vs. DTC Fulfillment Services: What's the Difference?
Factor | In-House Fulfillment | DTC Fulfillment Services (3PL) |
Best For | Under $1-3M revenue; 70%+ customers in one region | $3M+ revenue; national distribution needed |
Fixed Costs | High (rent, equipment, management) | Low (pay per order) |
Variable Costs | Labor, packaging, shipping | Per-order fees, storage |
Control | Complete control over operations | Less control; rely on 3PL SLAs |
Scalability | Limited by physical capacity | High; 3PL handles growth |
Technology Investment | $50K+ for WMS, systems | Included in 3PL fees |
Geographic Reach | Single location typically | Multi-location network available |
Expertise | Must build internally | Access to 3PL expertise |
Break-Even | Works until 3,000+ orders/month | Cost-competitive at 3,000+ orders/month |
When to switch from in-house to DTC fulfillment services:
- Current warehouse at 80%+ capacity with no room to expand
- Hiring fulfillment labor becoming difficult or expensive
- Technology investments required exceeding $50K+
- Expanding to multiple locations not feasible internally
- Fulfillment operations consuming 20%+ of executive attention needed for growth
Benefits of DTC fulfillment services:
Professional 3PLs provide multi-location networks that would take years to build, technology platforms that cost hundreds of thousands to implement, carrier discounts through aggregated volume, seasonal labor flexibility without hiring headaches, and expertise that prevents expensive mistakes.
DTC Fulfillment: Warehousing & Operations Strategy
Physical fulfillment operations determine your speed, accuracy, and cost structure. Smart warehouse strategy creates the foundation for profitable scaling.
Single-Node vs. Multi-Node Network Design
Single fulfillment center operations work until ~$3M revenue or when 80%+ of customers are in one region. You get simpler inventory management and lower fixed costs, but face longer shipping times to distant zones and higher per-package carrier costs.
Two-zone coverage at $3-5M revenue when 2-day delivery becomes competitive. Typical split: West Coast + East Coast or Central. For Canadian brands, a single Toronto/GTA warehouse serves 50% of Canada’s population, while Vancouver + Toronto covers 75%+. Montreal captures Quebec but requires bilingual packaging.
The two-node model reduces zone 6-8 shipping costs and improves delivery speed by 1-2 days. Brands using GoBolt’s Toronto and Vancouver facilities reduce average delivery time from 5-7 days to 2-4 days across Canada.
Multi-node operations (3+ locations) become necessary above $8-10M revenue for same-day or next-day metro delivery. This requires sophisticated inventory allocation but reduces shipping costs 15-25% through zone reduction.
For Canadian brands expanding to US markets, add a US fulfillment node once 30-40% of revenue comes from US customers to eliminate customs delays and brokerage fees that kill conversion.
Fulfillment Network Comparison
Metric | Single-Node | Two-Node | Multi-Node |
Ideal Revenue Stage | Under $3M | $3-8M | $8M+ |
Average Delivery Time | 5-7 days | 3-4 days | 2-3 days |
Shipping Cost Impact | Baseline | 15-20% reduction | 20-25% reduction |
Inventory Complexity | Low | Medium | High |
Fixed Cost Structure | Lowest | Medium | Highest |
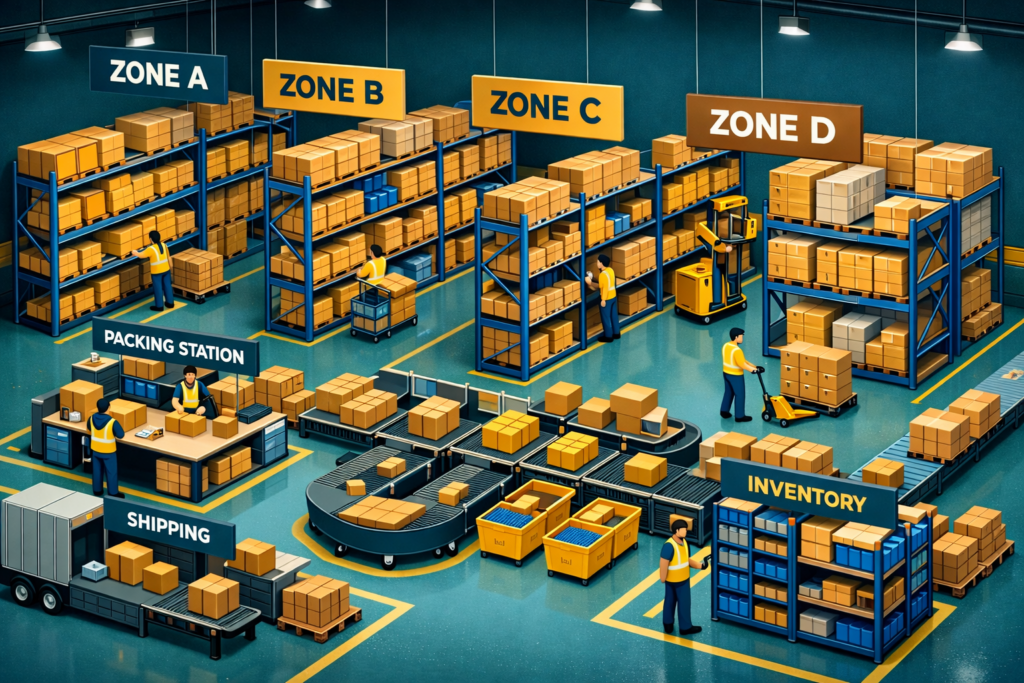
Warehouse Operations That Scale
Receiving and put-away: Advance ship notices (ASNs) from suppliers tell you what’s arriving before it shows up. Barcode scanning at receipt creates inventory accuracy from day one. Directed put-away means your system tells workers where to store items based on velocity—fast movers in forward pick locations, slow movers in bulk storage. Cycle counting integrated into put-away maintains 98%+ inventory accuracy without shutting down operations.
Pick-pack workflow efficiency: Batch picking (picking items for multiple orders in one pass) beats discrete picking for most operations. Zone picking works for large warehouses where different workers handle different product categories.
Quality control: Packing station design puts materials within reach. Automated label printing eliminates errors. Real-time order priority queues ensure time-sensitive orders get packed first. Weight verification flags missing items, random box checks maintain quality standards, and photo capture documents custom or high-value orders.
Space Planning and Seasonal Capacity
Calculate space requirements accounting for inventory value, SKU count, and turnover rate. Include space for receiving, packing stations, returns processing, and overflow. Plan for 30-40% capacity buffer for seasonal peaks.
Most DTC brands see 40-60% of annual revenue in Q4. Options include flex warehouse space, seasonal labor, or 3PL partnerships with built-in seasonal capacity.
Put fast movers in forward pick locations. Use bulk storage for slow movers. Legally segregate hazmat products. Quarantine returns before inspection. Consider vertical storage (pallet racking) to maximize space in expensive markets.
Evaluate whether your current facility can support 24-36 months of projected growth. Exiting leases or migrating warehouses mid-growth is expensive and risky.
Tech Stack & Order Orchestration
Technology transforms fulfillment from a manual cost center to a data-driven competitive advantage. But only if you integrate the right systems at the right time.
Core Fulfillment Technology Systems
Warehouse Management System (WMS): Manages inventory location, pick-pack workflows, labor tracking, receiving, and shipping. Essential by $2-3M revenue. Modern cloud WMS costs $1,000-$5,000/month. This isn’t optional at scale—manual spreadsheets create operational chaos.
Order Management System (OMS): Orchestrates orders across sales channels (Shopify, Amazon, wholesale), routes orders to appropriate fulfillment locations, manages cancellations and modifications. Critical when you have multiple warehouses or fulfillment sources.
Inventory Management Platform (IMP): Forecasts demand, generates purchase orders, tracks inventory across locations, provides analytics on turnover and stock health. Becomes necessary around $3-5M revenue when stockouts and overstock materially impact cash flow.
Transportation Management System (TMS): Optimizes carrier selection, negotiates rates through volume aggregation, tracks shipments, manages claims. Usually needed at $5M+ or when shipping 1,000+ packages daily.
For Canadian 3PLs specifically, ensure your WMS handles bilingual packing slips for Quebec, integrates with Canada Post’s API, and manages cross-border documentation.
Integration Architecture That Doesn't Break
Ecommerce platform integrations provide real-time order flow to your WMS. Inventory syncs back to prevent overselling. Order status updates flow to customers automatically. The system handles pre-orders, backorders, and split shipments.
Carrier integrations enable rate shopping across carriers for every package. Automated label generation eliminates manual entry. Tracking numbers ingest automatically and trigger customer notifications.
An API-first approach avoids manual data entry and CSV uploads that create errors. Systems communicate in real-time without human intervention.
Common integration pitfalls: order duplication when systems don’t dedupe properly, inventory sync delays causing overselling, and missing order attributes like gift messages that don’t transfer between systems.
For cross-border operations, your system should automatically route Canadian vs. US orders to appropriate fulfillment nodes, calculate duties at checkout, and generate customs documentation.
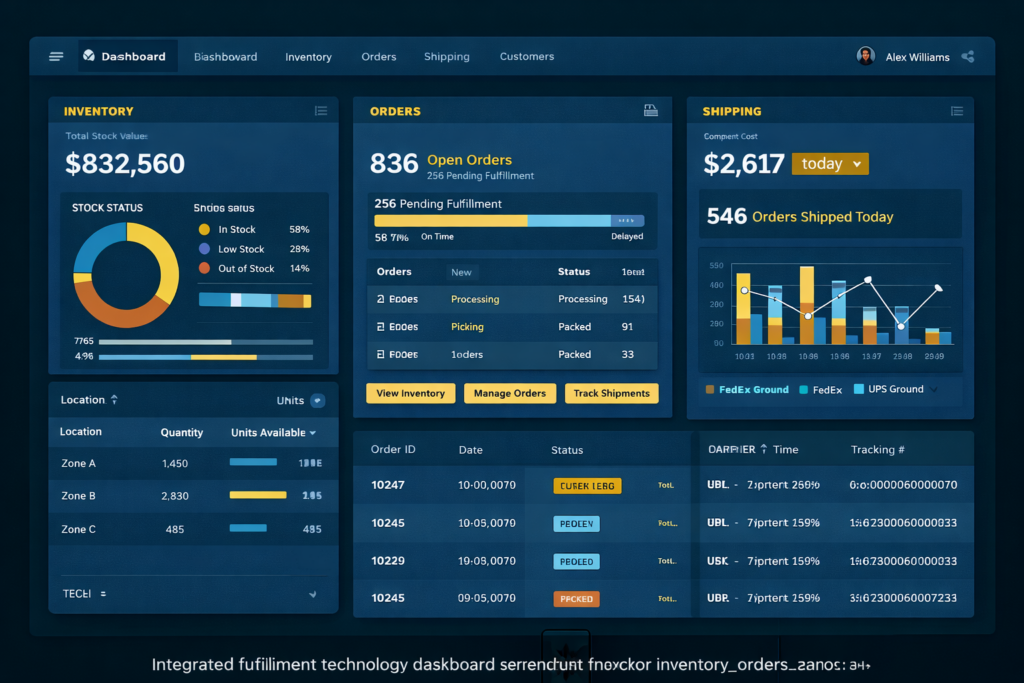
Data Visibility and Analytics
Real-time inventory visibility means knowing exactly what’s in stock, in transit from suppliers, allocated to orders, and available to promise. This prevents stockout surprises and customer disappointment.
Fulfillment performance dashboards track orders shipped same-day, average time from order to shipment, shipping accuracy, and returns rates. You identify bottlenecks before they become crises.
GoBolt’s 2025 State of Logistics Report found that 77% of startup brands identify last-mile performance and cost tracking as critical technologies, while 54% highlight real-time inventory tracking as essential—yet many lack these systems when they need them most.
Cost analytics help you understand cost per order by channel, product, and destination. This data drives strategic decisions about product mix, pricing, and channel expansion.
Predictive capabilities use historical data to forecast demand by SKU and week. You anticipate seasonal peaks, optimize reorder points, and run scenario planning for promotions.
Inventory & Demand Planning
Cash tied up in inventory can strangle growth, while stockouts kill momentum. Smart inventory strategy balances availability, cost, and risk.
Demand Forecasting for Growth Brands
Scaling brands face limited historical data, high growth rates, and unpredictable promotional impacts. Traditional forecasting methods struggle with these constraints.
Use statistical methods (moving averages, exponential smoothing) for established SKUs with 12+ months of data. Collaborative forecasting with sales and marketing works better for new launches—they know what’s coming. Target 70-80% forecast accuracy for established SKUs, 50-60% for new products. Focus on improving forecast accuracy for your top 20% of SKUs by revenue (typically 80% of your business).
Factor supplier lead times into reorder points: domestic suppliers need 2-6 weeks, overseas suppliers 8-16 weeks including ocean freight. Build supplier relationships for rush orders—air freight on fast movers at risk of stockout is cheaper than lost sales.
Inventory Positioning Strategy
Single location strategy holds all inventory at one fulfillment center. Simplest to manage, works until shipping costs or delivery speed become competitive issues.
Distributed inventory splits stock across 2-3 locations based on demand patterns. Allocation methods include: even split (simple but inefficient), demand-weighted (based on historical sales by region), predictive (forecasted demand by location), or dynamic reallocation (move inventory between nodes based on real-time demand).
Regular inventory balancing prevents imbalances. When one location has 12 weeks of inventory and another has 2 weeks, transfer stock—but account for transfer costs versus stockout costs.
Inventory Distribution Impact
Metric | Single-Node | Two-Node | Multi-Node |
Inventory Efficiency | High (centralized) | Medium (split stock) | Lower (more splits) |
Average Delivery Days | 5-7 | 3-4 | 2-3 |
Management Complexity | Low | Medium | High |
Ideal Revenue Stage | Under $3M | $3-8M | $8M+ |
Stock Health and Working Capital
Target 6-8 inventory turns per year for most DTC apparel and consumer goods. Higher turnover frees cash but increases stockout risk. Lower turnover ties up capital but provides buffer.
Identify slow-moving SKUs (under 1 unit per week) and create liquidation strategies: bundle deals, flash sales, or donations. Each $100K in excess inventory is $100K unavailable for marketing or growth. Balance inventory investment against growth capital needs.
Hold 2-4 weeks of safety stock for fast movers as buffer without excessive investment. Calculate economic order quantities (EOQ) to balance ordering costs against holding costs.
Transportation, Last Mile & Carrier Strategy
Shipping costs typically represent 7-12% of DTC revenue and directly impact customer satisfaction. Your carrier strategy determines both margin and experience.
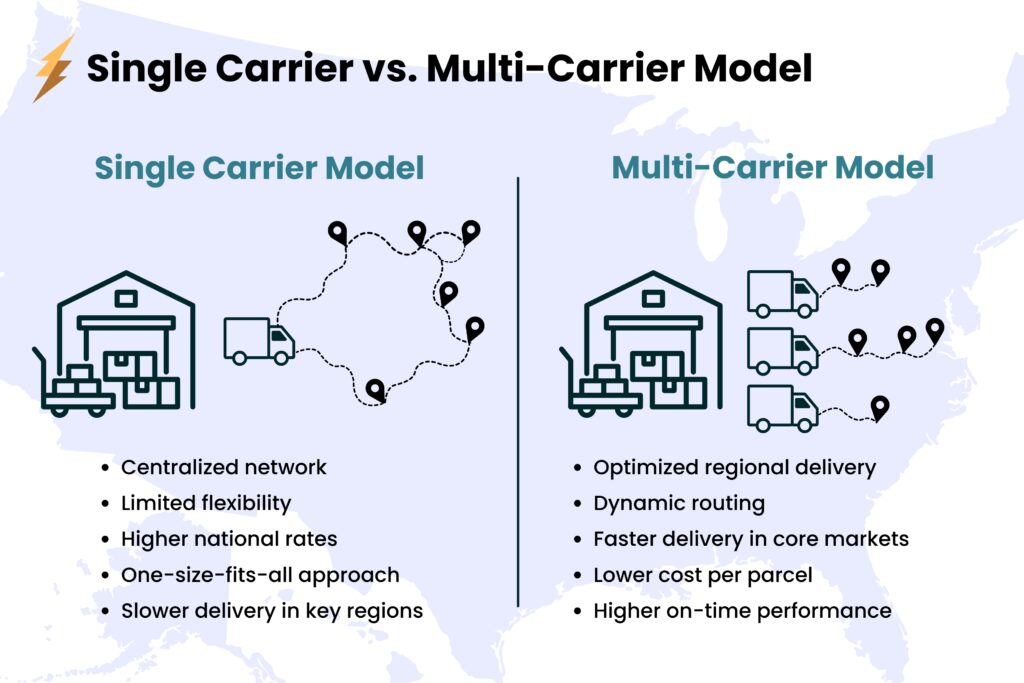
Carrier Selection and Diversification
Primary carrier options for US DTC brands:
- USPS (cost-effective for lightweight, slow timelines acceptable)
- UPS (reliable, good tracking, premium price)
- FedEx (comparable to UPS, strong for business addresses)
- Regional carriers (Lone Star, LaserShip – lower cost for specific regions)
- Amazon Shipping (if selling on Amazon)
Primary carrier options for Canadian DTC brands:
- Canada Post (broadest coverage including remote areas, cost-effective for lightweight, slower timelines)
- Purolator (reliable, good tracking, premium price, owned by Canada Post)
- Canpar (regional carrier, competitive pricing in urban areas),
- UPS/FedEx (premium pricing, best for cross-border and business addresses)
- Regional carriers (GoBolt Last Mile for urban markets – sustainable, flexible)
Industry data shows 65% of brands believe carrier diversification leads to cost reductions, while 55% cite improved delivery speed. Despite recognizing these advantages, brands overwhelmingly rely on 2-3 carriers. 68% want their 3PLs to expand shipping options specifically because managing multiple carriers is operationally difficult.
59% find it difficult to manage costs across multiple carriers. Working with a 3PL that handles multi-carrier rate shopping alleviates this complexity through automated rate comparison.
Rate shopping through multi-carrier software can reduce shipping costs 10-20%. Your carrier diversification strategy should avoid single-carrier dependency. Peak season capacity constraints require backup options. Typical mix: 60% primary carrier, 30% secondary, 10% regional/specialty.
Volume-based negotiations become possible once you’re shipping 500+ packages daily. Negotiate both base rates and surcharge waivers. For Canadian brands, the market is less competitive than the US, making negotiations harder but still worthwhile.
Contract terms matter. Annual commitments lock in rates but require volume minimums. Negotiate quarterly true-ups rather than annual commitments for fast-growing brands.
Carrier Comparison for DTC Brands
Carrier | Cost | Speed | Tracking | Coverage | Best Use Cases | Remote Coverage |
US: USPS | Low | Slow | Basic | Excellent | Lightweight, non-urgent | Yes |
US: UPS | High | Fast | Excellent | Good | Business, guaranteed | Limited |
US: FedEx | High | Fast | Excellent | Good | Business, time-sensitive | Limited |
US: Regional | Medium | Medium | Good | Regional | Zone 1-4, high volume | No |
CA: Canada Post | Medium | Slow | Good | Excellent | Standard, remote areas | Yes |
CA: Purolator | High | Fast | Excellent | Good | Time-sensitive, urban | Limited |
CA: Canpar | Medium | Medium | Good | Urban only | High volume, urban | No |
CA: GoBolt | Medium | Fast | Excellent | Urban metros | Sustainable, flexible | No |
Last Mile Delivery Strategy
Last mile delivery represents 40-50% of total shipping costs and determines the actual delivery experience.
Delivery speed expectations: Standard (5-7 business days) acceptable for low-price products. 3-4 day delivery is competitive baseline for most DTC. 2-day becoming expected for premium brands. Expedited/overnight for high-AOV or urgent needs.
Canadian last-mile delivery faces unique challenges. Rural and northern delivery adds 2-5 days and significantly higher costs. Over 80% of orders concentrate in Toronto, Montreal, Vancouver, Calgary, and Ottawa metros.
Zone-based shipping costs create the economic case for multi-node fulfillment. Zones 1-4 cost significantly less than zones 5-8. Moving from 100% zone 5-8 to 60% zone 1-4 shipments cuts costs meaningfully at volume.
Emerging delivery models include gig economy delivery (Uber, DoorDash) for same-day in metros, consolidated delivery where customers pick up at convenient locations, and subscription programs that offset shipping costs.
Sustainable last-mile delivery matters increasingly. Electric vehicle delivery fleets, carbon-neutral shipping options, package consolidation, and route optimization all contribute to environmental goals. GoBolt’s electric vehicle fleet in major metros appeals to environmentally conscious Canadian consumers.
Shipping Cost Management
- Packaging optimization prevents dimensional weight penalties. Right-size boxes to eliminate wasted space. Use poly mailers for non-fragile items. Eliminate void fill when possible. For high-volume SKUs, invest in custom-size packaging.
- Rate table strategy: Free shipping thresholds set at 20-30% above your average order value encourage larger carts while maintaining margin. Flat-rate shipping is simple but may lose money on distant zones. Real-time rates pass through actual carrier costs plus margin. Membership programs charge annual fees for free shipping.
- Shipping cost as acquisition tool: Free shipping increases conversion rates 20-40% but erodes margin on first order. Calculate lifetime value to determine acceptable customer acquisition cost.
- Hidden shipping costs add up: Address corrections ($15-20 per package), undeliverable returns to sender ($10-15), residential delivery surcharges ($4-5 per package), signature requirements, Saturday delivery. Ensure your systems avoid these—accurate address validation at checkout prevents most address corrections.
Benchmark your all-in shipping costs (carrier fees + packaging + labor) as percentage of revenue. Healthy DTC brands target 8-12%. Above 15% indicates inefficiency or low AOV. Below 6% typically means very high AOV or you’re underserving customers with slow, cheap shipping.
Canadian Cross-Border Fulfillment
Add US fulfillment once 30-40% of revenue comes from US customers. At this threshold, friction costs of cross-border shipping outweigh complexity and fixed costs of adding a US location.
Customs and duties management creates conversion friction. US customers ordering from Canadian warehouses face customs brokerage fees of $15-30 per package plus duties varying by product category (5-15% for most consumer goods). Many customers abandon carts when discovering these fees.
Documentation requirements include commercial invoices for every cross-border shipment, harmonized tariff codes for accurate duty calculation, and USMCA/CUSMA compliance documentation. Your systems must generate this correctly for every order.
Technology requirements for cross-border operations include systems that calculate and display duties at checkout (landed cost), generate customs documentation automatically, and route orders to correct fulfillment locations. Without this automation, cross-border fulfillment becomes operationally overwhelming.
Reverse logistics complexity doubles for cross-border returns. When US customers return products to Canadian warehouses, returns face the same customs and duties processes in reverse. Many brands handle this by writing off low-value returns.
Canadian DTC Fulfillment Considerations
Canadian DTC brands face unique challenges. 90% of Canada’s population concentrates within 100km of the US border, while Toronto to Vancouver spans 4,400km—creating shipping cost and delivery time challenges US brands don’t face.
Canada Post dominates with its mandate to serve all addresses, but you have fewer competitive carrier options than in the US market. Regional carriers like Canpar and Purolator provide urban alternatives, but coverage gaps exist rurally.
Cross-border complexity becomes critical for brands selling to both Canadian and US customers—managing duties, customs documentation, brokerage fees, and longer delivery times.
Common DTC Fulfillment Challenges and Solutions
Managing Shipping Cost Volatility
Carrier rates jump 5-7% annually, and dimensional weight pricing punishes lightweight, bulky products. Negotiate volume discounts once you’re shipping 1,000+ packages monthly, and use multi-carrier strategies to compare rates per shipment. Regional carriers often beat FedEx and UPS on zones 2-4.
Handling Peak Season and Returns
Q4 order volume can triple your baseline, and returns spike post-holiday. Hire temporary staff 4-6 weeks before peak season starts. Set clear return windows and automate restocking workflows to get inventory back on shelves faster. Returns processing shouldn’t take more than 48 hours.
Maintaining Fulfillment Accuracy
Pick-and-pack errors cost you twice: the original shipment and the replacement. Barcode scanning reduces errors to under 1%. If you’re still using paper pick lists, you’re probably running 3-5% error rates without realizing it.

Returns, Sustainability & Customer Experience
Returns management and sustainability initiatives directly impact customer loyalty, lifetime value, and operational costs. They’re no longer optional at scale.
Reverse Logistics and Returns Processing
Returns rates vary significantly by category. Apparel averages 20-30% returns. Footwear sees 15-25%. Consumer electronics average 8-12%. Beauty and consumables stay low at 5-10%. Factor your expected return rate into unit economics and inventory planning.
Your returns process should provide pre-paid return labels ($6-10 cost per return). Returnless refunds make sense for low-value items where processing costs more than product value. Inspect returned items within 24-48 hours. Restock sellable inventory immediately. Liquidate damaged items through secondary channels.
Returns management systems, like Two Boxes, integrate with your WMS to receive returns, inspect condition, and restock efficiently. Track return reasons to identify product issues or communication gaps. Provide customers with return status updates automatically. Issue refunds within 5 business days of receipt.
According to GoBolt’s 2025 State of Logistics Report, 52% of brands cite returns management as a top value-added service, with 34% wanting their 3PLs to invest more in returns processing technology.
All-in cost of returns includes return shipping, inspection labor, restocking labor, liquidation of damaged goods, and customer refund. Total cost typically runs $15-25 per return. High return rates destroy margin—a 30% return rate on a 40% margin product can cut net margin in half.
Return reduction strategies: better product descriptions and accurate sizing guidance, customer photos and reviews, virtual try-on or fit tools where applicable. Some brands charge return fees to reduce returns, but this hurts conversion. Analyze return reasons systematically to fix underlying issues.
Sustainability and Green Fulfillment
60-70% of millennial and Gen Z consumers consider sustainability in purchase decisions. B Corp certification and ESG commitments increasingly matter for wholesale partnerships and institutional investment. Regulatory pressure is increasing.
Packaging sustainability means moving from virgin to recycled materials. Eliminate plastic packaging where possible. Right-size packaging reduces both waste and dimensional weight charges. Use paper tape instead of plastic. Include recycling instructions.
Carbon-neutral shipping works through carrier carbon offset programs or direct investment in offset projects. Electric vehicle last-mile delivery reduces emissions significantly—GoBolt’s EV fleet in Toronto, Vancouver, and other major metros provides brands with a concrete sustainability story.
According to the 2025 State of Logistics Report, 51% of brands value partnering with sustainable carriers, and 65% see route optimization for fuel efficiency as valuable. Electric vehicle delivery options help brands meet customer expectations while reducing carbon footprint.
Warehouse sustainability initiatives include solar power, LED lighting, energy-efficient HVAC, waste reduction and recycling programs, and water conservation.
Sustainable returns management includes refurbishing and reselling returned items. Donate unsellable goods for tax benefits. Implement take-back programs for end-of-life products.
ROI of sustainability investments: Sustainable packaging costs 5-15% more but improves brand perception. Carbon-neutral shipping adds $0.10-0.50 per package but drives customer loyalty.
Customer Experience Excellence
Order confirmation and last mile delivery tracking should trigger automated emails within minutes. Send tracking information as soon as label is created. Provide proactive delivery updates. SMS notifications for out-for-delivery and delivered status reduce “where is my order” support contacts.
Packaging as brand touchpoint influences reviews and social sharing. Include branded inserts, thank-you notes, discount codes for next purchase. Balance brand impact with cost, budgeting $0.50-2.00 per package depending on your AOV and positioning.
Delivery exceptions management requires proactively monitoring delayed shipments. Reach out to customers before they complain. Offer solutions: reship, refund, or discount on next order. Train your support team on fulfillment operations.
Post-delivery engagement means requesting reviews 7-14 days after delivery. Follow up on returns to understand root causes. Track Net Promoter Score specifically about delivery experience separate from overall brand NPS.
Fulfillment as competitive moat: Amazon set customer expectations for fast, reliable, transparent delivery. DTC brands must match or exceed these standards to compete.
KPIs That Matter When Scaling
Measuring fulfillment performance ensures you’re scaling efficiently, identifying problems early, and making data-driven infrastructure investment decisions.
Operational Efficiency Metrics
Order accuracy rate: Percentage of orders shipped without errors. Target 99.5%+ accuracy (1 error per 200 orders). Track pick errors, pack errors, and shipping errors separately to identify root causes.
Orders shipped same-day: Percentage of orders received by cutoff time that ship same day. Target 95%+. Same-day shipment effectively adds 1-2 days to delivery speed.
Inventory accuracy: System inventory matches physical inventory. Measure through cycle counts. Target 98%+. Low accuracy causes stockouts and overselling.
Warehouse capacity utilization: Percentage of available space in use. Target 60-70% average to maintain efficiency while allowing for seasonal peaks. Over 85% indicates need for expansion.
Cost and Financial Metrics
Cost per order: All-in fulfillment cost including labor, rent, equipment, technology, packaging, shipping. Should decrease on percentage basis as you scale. Track monthly to catch cost creep.
Shipping cost as percentage of revenue: Target 8-12% for most DTC brands. Above 15% indicates inefficiency or low AOV. Below 6% may indicate slow shipping or very high AOV.
Inventory carrying cost: Warehouse space rent, insurance, obsolescence, and opportunity cost of tied-up capital. Typically 20-30% of inventory value annually.
Return rate and cost: Track as both percentage of orders and total cost. High return rates tank profitability. Break down by product, channel, and customer segment.
Fulfillment KPI Dashboard
KPI | Target Range | Why It Matters | How to Improve |
Order Accuracy | 99.5%+ | Errors cost double: original shipment + fix | Barcode scanning, weight verification |
Same-Day Ship Rate | 95%+ | Adds 1-2 days to delivery speed | Earlier cutoff, better batching |
Inventory Accuracy | 98%+ | Prevents stockouts and overselling | Cycle counting, directed put-away |
Shipping % of Revenue | 8-12% | Indicates efficiency and strategy effectiveness | Carrier diversification, network design |
Return Rate | <15% (varies) | Returns destroy margin and tie up inventory | Better descriptions, sizing guidance |
Customer-Facing Metrics
Average delivery time: Days from order to delivery. Benchmark against competitors. Target 3-5 days average for competitive positioning. Track by destination to identify geographic issues.
On-time delivery rate: Percentage delivered by promised date. Target 95%+. Carrier performance often out of your control, but you own the promise.
Shipping notification timing: How quickly tracking info reaches customers. Should happen within 24 hours of order placement.
Net Promoter Score (NPS) – Delivery: Track delivery experience separately from overall brand NPS. Isolates whether fulfillment is helping or hurting brand perception.
Customer support contacts per order: Target under 5% of orders generating support contacts. Higher rates indicate fulfillment problems driving support volume.
How to Choose the Right 3PL Partner
Outsourcing fulfillment to a third-party logistics provider can unlock growth, but choosing the wrong partner creates expensive operational headaches.
When to Consider a 3PL
Signals you’ve outgrown in-house fulfillment: current warehouse at 80%+ capacity, hiring fulfillment labor difficult or expensive, technology investments exceeding $50K+, expanding to multiple locations not feasible internally, and fulfillment operations consuming executive attention needed for growth.
Build versus buy math requires comparing all-in cost of in-house operations (labor, rent, equipment, technology, management overhead) versus 3PL fees (typically $3-7 per order plus storage). 3PLs usually become cost-competitive at 3,000+ orders per month. Don’t forget opportunity cost of executive time and capital investment.
Benefits beyond cost: professional 3PLs provide multi-location networks, technology platforms, carrier discounts through aggregated volume, seasonal labor flexibility, and expertise that prevents expensive mistakes.
3PL Evaluation Framework
Network and infrastructure: Do they have locations where you need to serve customers? What’s their capacity? Tour facilities to assess organization, cleanliness, security, and technology. A messy warehouse indicates operational problems.
Technology capabilities: What WMS do they use? What integrations do they offer with your e-commerce platform? Can you get real-time inventory visibility? Request a demo of their actual platform, not screenshots.
Service levels and specialization: Do they have experience with your product type? Can they handle special requirements (kitting, customization, gift wrap, subscription boxes, hazmat)? What are their guaranteed SLAs? Get specific commitments in writing.
Pricing structure: Get detailed pricing for storage, receiving fees, pick and pack, shipping, returns processing, and special services. Watch for hidden fees: account management fees, technology fees, monthly minimums. Understand how pricing scales with volume.
According to the 2025 State of Logistics Report, 92% of brands see value in 3PLs that have integrated their own first-party last-mile delivery solution, eliminating handoff issues between warehousing and final delivery.
3PL Evaluation Checklist
3PL Evaluation Checklist
Evaluation Criteria | What to Look For | Red Flags to Avoid |
Geographic Coverage | Facilities in markets you serve; expansion plans align | Single location when you need multi-node |
Technology Platform | Real-time integrations; modern WMS; API-first | Batch updates; manual processes |
Pricing Transparency | Detailed, written pricing; volume discounts | Vague quotes; hidden fees |
Specialization Match | Experience with your product type | Generalist claiming they do everything |
Scalability | Clear capacity numbers; growth plan | Already near capacity |
Customer References | Willing to provide 3+ references; positive feedback | Won’t provide references |
Partnership Management
Contract considerations: Avoid long-term commitments until proven relationship—start with 12-month terms. Negotiate clear exit terms and data ownership. Understand minimum volume requirements and penalties.
The 2025 State of Logistics Report found that 60% of brands have changed 3PL providers multiple times due to ongoing delivery issues. This emphasizes thorough evaluation upfront.
Onboarding and migration: Plan 60-90 days for onboarding. Migrate inventory gradually if possible. Expect 2-3 weeks of lower service levels during transition. Maintain backup inventory if feasible.
Ongoing governance: Establish weekly operational reviews during first 90 days, monthly business reviews with scorecards against SLAs, and quarterly strategic planning. Maintain direct relationships with operations managers, not just account managers.
When to switch 3PLs: Consistent SLA misses despite escalation, pricing increases outpacing market rates, inability to scale with your growth, technology platforms that don’t integrate well, and fundamental misalignment on service level priorities.
Build the relationship as partnership. Share growth plans and forecasts. Involve them in new product launches. Treat their team as extension of your operations organization.

FAQ
↔️ What's the difference between 3PL and in-house fulfillment?
In-house fulfillment means your team handles everything: receiving inventory, storing it in your own warehouse or office, picking and packing orders, and coordinating with carriers. 3PL fulfillment outsources these tasks to a logistics partner. In-house gives you maximum control and lower per-order costs at low volume, but requires staff, space, and systems. 3PLs offer scalability, faster shipping (multiple locations), and expertise, but add per-order fees. Most brands switch from in-house to 3PL when they reach $750K-$2M in revenue.
📝 What should I look for when evaluating a 3PL partner?
Check that they integrate directly with your e-commerce platform without needing a developer, and confirm they provide real-time inventory syncing. Compare their warehouse locations against where your customers live-a single East Coast facility won’t get you two-day delivery on the West Coast. Get a complete fee breakdown upfront, including storage, pick and pack, receiving charges, and special handling costs, because some partners quote low base rates then bury you in surcharges.
🤔 What are the biggest challenges in DTC fulfillment?
The five biggest challenges are: (1) Inventory accuracy—keeping stock counts correct across multiple channels, (2) Shipping speed expectations—customers expect 2-day delivery even during peak season, (3) Returns management—processing returns quickly while maintaining inventory integrity, (4) Peak season capacity—handling 3-5x normal volume during Q4 without delays, and (5) Cost management—balancing fast shipping with profitability as you scale. Most of these challenges become easier with the right 3PL partner or robust warehouse management system.
💻 What technology do I need for DTC fulfillment?
At minimum, you need an ecommerce platform (Shopify, WooCommerce, BigCommerce), a shipping solution (EasyShip, ShipStation, or built-in platform shipping), and basic inventory tracking. As you scale past $1M, add a warehouse management system (WMS) for inventory accuracy, an order management system (OMS) for multi-channel selling, and 3PL integration for automated order routing. If you work with a modern 3PL, they typically provide these systems as part of their service, connecting directly to your ecommerce platform via API.
📈 At what order volume should I switch from in-house fulfillment to a 3PL?
Most brands stay in-house until they hit 1,000-1,500 orders monthly. Below that threshold, 3PL fees eat too much margin to justify the cost. Once you’re consistently above 5,000 orders per month, you’ll need serious warehouse infrastructure or multiple 3PL locations to maintain delivery speed, which makes outsourcing more attractive.
📉 How can I reduce shipping costs without slowing down delivery times?
Negotiate volume discounts once you’re shipping 1,000+ packages monthly, and set up multi-carrier rate shopping to compare costs per shipment in real-time. Regional carriers often beat FedEx and UPS on shorter distances (zones 2-4), which can save 15-30% per package. Your 3PL or shipping software should handle this comparison automatically.
⚠️ What's an acceptable error rate for pick-and-pack operations?
You should aim for under 1% error rates, which is achievable with barcode scanning systems. If you’re using paper pick lists, you’re probably running 3-5% error rates without realizing it. Each mistake costs you twice-once for the wrong shipment and again to send the replacement-so accuracy directly impacts your margins.
📊 How do I prepare for peak season order volume spikes?
Hire temporary staff 4-6 weeks before peak season starts, not when you’re already slammed. Your Q4 volume can triple your baseline, so plan capacity accordingly. Set clear return windows and automate restocking workflows so returns don’t pile up-your returns processing shouldn’t take more than 48 hours to get inventory back on shelves.
The Bottom Line
DTC fulfillment at the $1M-$10M revenue stage isn’t about perfection. It’s about building scalable infrastructure that keeps pace with growth without consuming all your margin or executive bandwidth.
GoBolt’s 2025 State of Logistics Report, surveying 263 DTC brands across North America, found that successful brands no longer accept the false tradeoff between cost and speed. The winning strategy combines carrier diversification (reducing costs while improving delivery times), integrated technology platforms that eliminate blind spots, and 3PL partners capable of supporting both DTC and wholesale channels. 68% of brands cite delivery delays as their top operational pain point, yet 60% have switched providers multiple times—emphasizing the critical importance of choosing the right partner from the start.
Your Next Steps
Audit your current state. Calculate your true all-in cost per order, average delivery time by province, inventory turnover, and return rate. Compare these metrics against the benchmarks in this guide. Most brands underestimate their real costs by 30-40% when they finally do this analysis.
Map your 12-month requirements. Forecast order volume, SKU count, and geographic distribution for the next four quarters. Assess whether your current infrastructure can handle projected growth or when you’ll hit constraints. If 30%+ of revenue comes from US customers, evaluate the ROI of adding a US fulfillment node.
Make the build versus buy decision. If you’re processing 3,000+ orders per month and fulfillment is consuming more than 20% of operational leadership time, evaluate 3PL options. For Canadian DTC brands, prioritize 3PLs with Canadian facilities and Canada Post integrations. [Link to: Contact GoBolt for 3PL evaluation]
Prioritize high-impact improvements. Start with changes that impact both cost and customer experience—often carrier diversification, inventory positioning, and order orchestration technology deliver the fastest ROI. Focus on 80/20 improvements that move the needle.
The brands that scale successfully from $1M to $10M treat fulfillment as a strategic growth driver, not just an operational cost center. They invest in infrastructure ahead of growth, measure performance rigorously, and partner with specialists to access capabilities they can’t build internally.
GoBolt works with Canadian DTC brand to scale, providing fulfillment infrastructure across Toronto and Vancouver, sustainable last-mile delivery in metro markets, and the technology integration needed to scale.
DTC Resources
For deeper dives into specific topics:
Best Services for DTC Brands
- Best 3PL for U.S. DTC Brands
- Best 3PLs for Canadian DTC Brands
- Best Parcel Services
- Best Fulfillment Center for DTC Brands
- Best Fulfillment Services for Growing DTC Brands
How-to’s and Guides for DTC
- Omnichannel Fulfillment Guide
- Retail Fulfillment Guide
- Why DTC Brands Stall Between $1M and $10M
- How Smart Packaging Lowers Shipping Costs
- The Shipping Playbook: Guide to Carrier Diversification
- 6 Headaches Keeping DTC Operators Up At Night (And How to Fix Them)
GoBolt Case Studies
GoBolt Services