
- Last updated on
- November 11, 2025
- Written by:
- Amanda Conway
You’ve got the reports. Carrier dashboards, 3PL portals, weekly summaries landing in your inbox like clockwork. But when you open them, what happens? You scan the numbers, flag something that looks off, then close the tab and move to the next fire.
Sound familiar?
You’re drowning in shipping data but can’t find the time to turn it into anything useful. Stuck in passive reporting mode, watching metrics instead of moving them. The question isn’t whether you have enough data-it’s whether you can turn shipping data from passive reporting into action.
The gap between collecting data and optimizing your last mile isn’t about technology. It’s about having a framework that tells you what to look at, when to act, and what changes to make.
TL;DR
- Most shipping data sits unused because dashboards display information but don’t drive decisions or tell you what to do next.
- Focus on four metrics that matter: on-time rate, cost per shipment, carrier performance, and claim rates.
- Set specific thresholds that trigger action, like investigating when carrier performance drops below 92% or late deliveries hit 5%.
Document response protocols so when thresholds get crossed, your team knows exactly what to do.
Most operations teams have access to more shipping data than ever before. Last mile carrier portals show transit times, 3PL dashboards display costs, and weekly reports track delivery rates. Yet when decisions need to be made, teams still operate on gut instinct and reactive problem-solving.
Table of Contents
Why Most Shipping Data Sits Unused
The Dashboard Trap
Dashboards weren’t built for action. They’re designed to display information, not drive decisions. You log in, scan a few metrics, maybe spot something off, then move on.
The issue isn’t data overload — it’s a framework gap. Without a clear method for interpreting data and acting on it, those numbers just sit there, looking official but doing nothing.
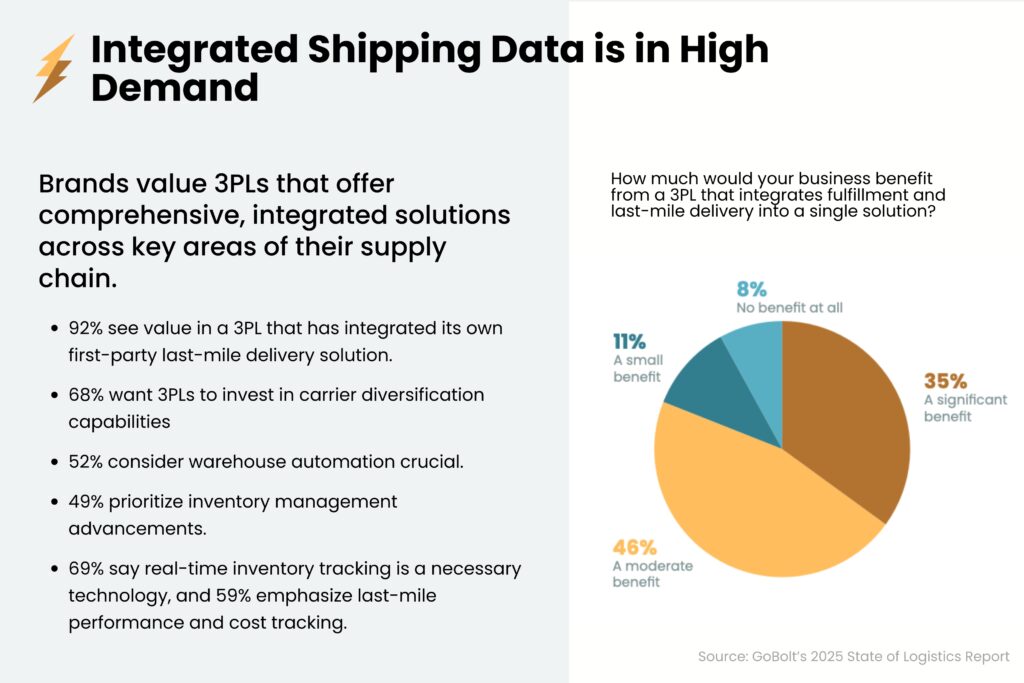
📊 According to GoBolt’s 2025 State of Logistics Report, 69% of brands say they struggle to connect shipping data to operational decisions — proving that visibility without action remains one of the industry’s biggest challenges.
From Reactive Firefighting to Proactive Optimization
When delivery windows are missed or costs spike unexpectedly, you investigate — reactively. You fix the issue and move on, but rarely change the system.
To truly optimize, you need to flip the script. Build systems that surface issues before they become fires, with clear signals of what to fix first and why it matters.
Teams that adopt this proactive mindset see measurable improvements — faster issue resolution, fewer costly exceptions, and more predictable delivery performance.
The Action Framework - Connecting Data Points to Business Decisions
Step 1 – Identify Decision-Critical Metrics
Stop tracking everything. Focus on metrics that directly affect costs or customer experience:
- On-time rate
- Cost per shipment
- Carrier performance
- Claim rate
These four metrics drive most logistics decisions. Everything else is noise.
Step 2 – Set Action Triggers and Thresholds
Each metric should have a trigger that prompts action.
- If late deliveries hit 5%, who’s responsible for investigating?
- If cost per shipment jumps 15% week-over-week, who gets notified?
Set thresholds based on business impact, not industry averages. For example, a 5% late rate might be acceptable for non-urgent goods — but unacceptable for perishables.
Step 3 – Build Response Protocols
When thresholds are crossed, what’s the next move? Document it.
For example:
- If carrier performance drops below 92%, investigate within 24 hours and contact your account manager.
- If damage rates spike on a route, flag it for packaging review.
Modern tools like GoBolt’s Merchant Portal can automate these alerts so you’re not manually checking dashboards for problems. The key is to turn insight into standard operating procedure.
Building Your Action-Oriented Data System
Start Small: High-Impact, Low-Complexity Wins
Pick one metric that’s reducing your margins right now. Maybe it’s claims or shipping costs. Use your existing 3PL tools or carrier portals before building custom dashboards. Look for quick, high-impact wins you can achieve this quarter.
Integrate Without Overcomplicating
You don’t need perfect data centralization to make better decisions. Most platforms (including GoBolt’s Merchant Portal) already offer robust exports, API access, and integrations.
If you can view cost per order and delivery performance in one place, you have enough visibility to act.
FAQ
📊 What's the difference between passive reporting and actionable shipping data?
Passive reporting means you scan dashboards and track metrics without a clear system for making decisions. Actionable data has defined thresholds, triggers, and response protocols that tell you exactly what to do when a metric crosses a specific line. The data itself is the same-the difference is having a framework that connects numbers to business decisions.
🔎 Which shipping metrics should I actually focus on?
Four metrics drive most logistics decisions: late delivery rate, cost per shipment, carrier performance variance, and damage rates. These directly impact your costs and customer experience. Everything else creates noise that distracts from high-impact changes you can make right now.
🚨 How do I set the right thresholds for action triggers?
Base thresholds on your specific business impact, not industry averages or arbitrary numbers. A 5% late delivery rate might work fine for non-urgent shipments but could kill your business if you ship perishables. Look at what actually hurts your bottom line or customer satisfaction, then set triggers just before that point.
💻 Do I need a custom dashboard or data science team to make this work?
No. Start with your existing 3PL tools and carrier portals-most have more functionality than teams actually use. Pick one metric that’s costing you money, set up basic alerts if available, and document what you’ll do when things go wrong. You can capture significant wins before investing in custom integrations or new technology.
📝 What should a response protocol actually look like?
A response protocol documents exactly what happens when a threshold gets crossed. If carrier performance drops below 92%, you investigate the root cause within 24 hours and contact your account manager. If damage rates spike, you flag it for packaging review. Make it specific enough that anyone on your team knows the next step without asking.
The Bottom Line
Your shipping data is already telling you where money’s leaking and where customers are getting burned. The problem is you’re watching it happen instead of stopping it. A simple framework that connects metrics to thresholds to specific actions transforms those reports from background noise into a decision engine that runs without you babysitting every dashboard.
Here’s what you should do next:
- Pick the one metric that’s costing you the most right now – late deliveries, cost per shipment, or carrier performance – and set a specific threshold that triggers investigation
- Document exactly what happens when that threshold gets crossed: who investigates, within what timeframe, and what actions they can take
- Check if your current 3PL or carrier platform can automate these alerts, so you’re notified when problems surface instead of hunting for them
- Run this process for 30 days, capture one measurable win, then expand to your next highest-impact metric
Stop treating shipping data like a report card you check after the damage is done. Turn it into an early warning system that fixes problems while they’re still cheap to solve.